Power BI Custom Visual
Targets and progress, clearly.
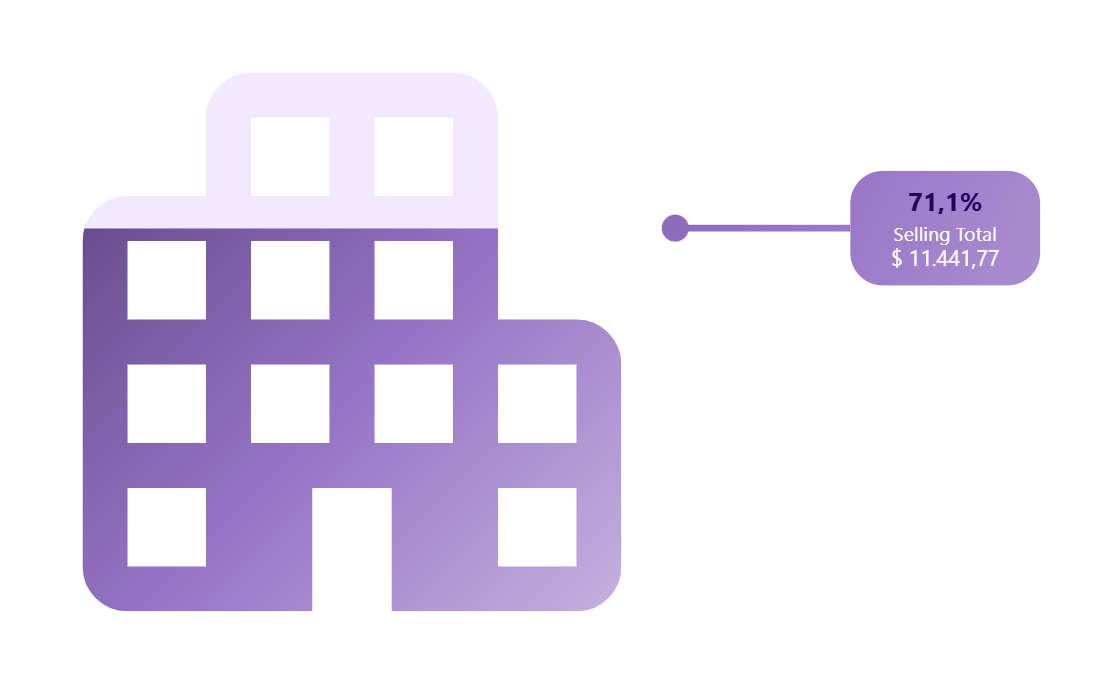
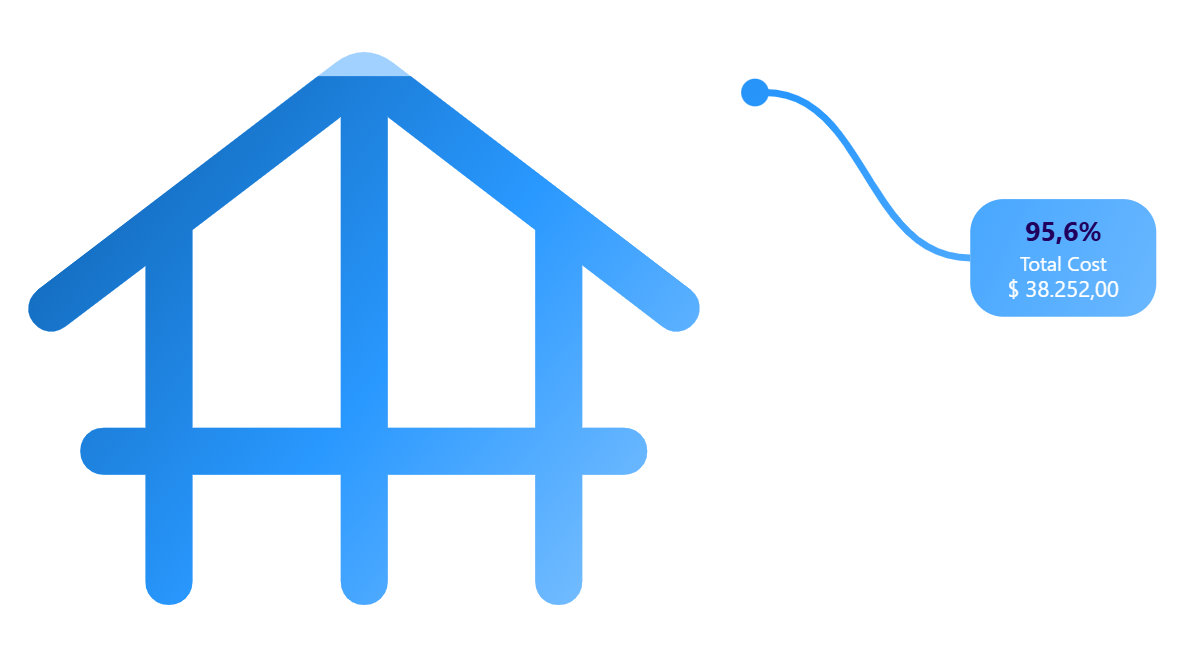
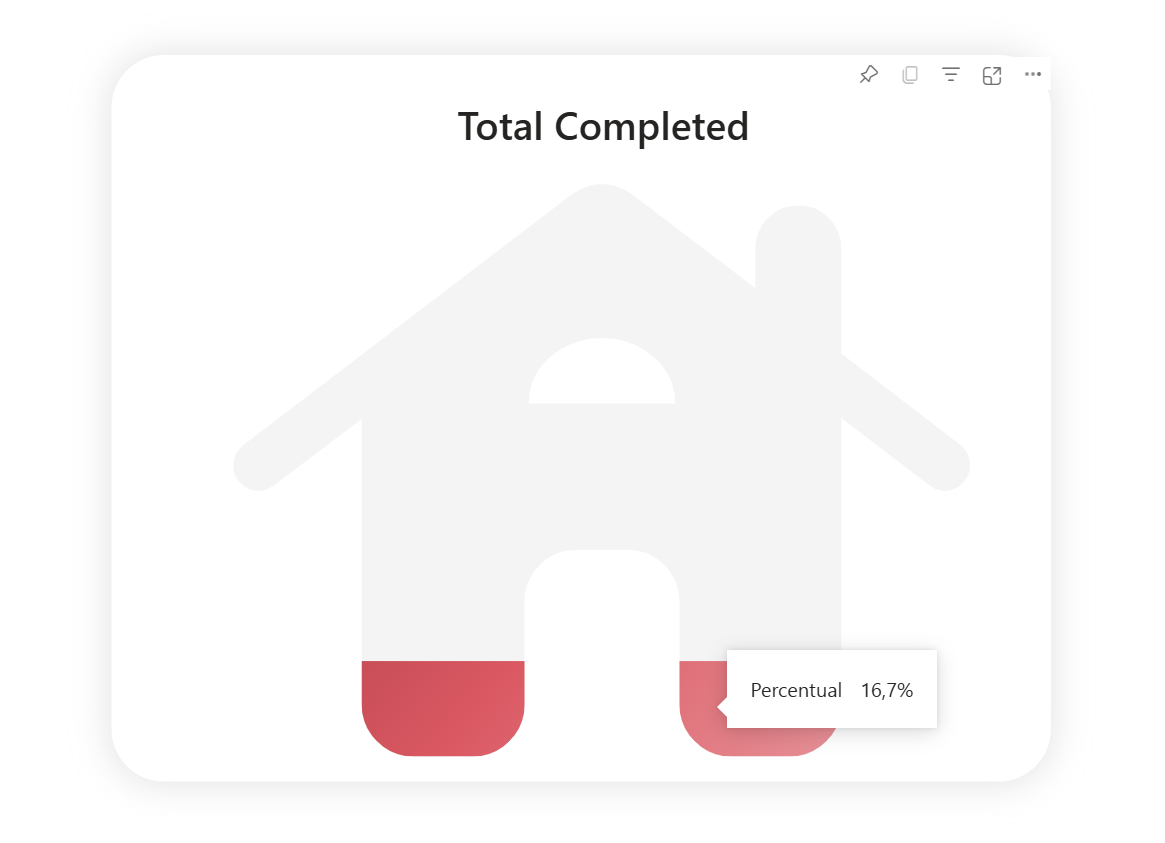
Targety Construction KPI turns “Value vs Target” into an intuitive visual indicator, with animated fill in modern construction icons (houses/buildings, etc) based on Google’s Material Design library.
Tip: replace the AppSource link once published.
Key benefits
Faster delivery
Add a target vs actual KPI without custom visuals or layout hacks.
Clear for stakeholders
Animated fill and icons make progress obvious for non-technical users.
Consistent dashboards
Keep a consistent KPI style across pages and projects, making maintenance easier.
Simple setup
Map Value and Target and fine-tune in the formatting pane.
Brand-friendly styling
Control colors, pill labels, and tooltip content to match your report’s design.
Less rework
Make goal status explicit so you spend less time explaining numbers.
Need help?
Message our team and we’ll get back to you soon.